Data-driven design
- TOC
- What's data-driven design?
- Types of Data for Design
- How to implement Data-Driven Decisions in the Design Process
- Resesarch tools
What's data-driven design?
Data driven design is a method of making design decisions based on data collected by designers. It has a great potential of perfecting design in a way of fulfilling user needs and keeping them happy.
Data driven design uses quantitative and qualitative data to inform and shape design decisions in digital product development. Designers use actual user behavior and preferences from user research to drive decision-making, creating more effective and user-centric solutions.
Being data-driven means making decisions and taking actions based on empirical evidence and insights derived from data analysis, rather than relying solely on intuition, assumptions, or personal opinions.
Types of Data for Design
There are two types of data UX designers and stakeholders rely on for decisions:
- Quantitative data – what, when, and how it happens
- Qualitative data – why it happens
Quantitative data
Quantitative data is numerical and measurable, giving designers objective insights into user behavior and interactions. This quantifiable data type is valuable for identifying trends and patterns, allowing designers to make informed decisions based on hard evidence.
Qualitative data
Qualitative data is non-numerical and focuses on subjective user opinions, feelings, and motivations. This qualitative data helps designers understand the “why” behind user behavior, offering a deeper insight into user needs and preferences.
Important Data Sources for Designers
Here are six domains where design teams typically source data:
- Analytics tools
- User surveys & interviews
- A/B testing
- Usability testing
- Heatmaps & click tracking
- Multivariate testing
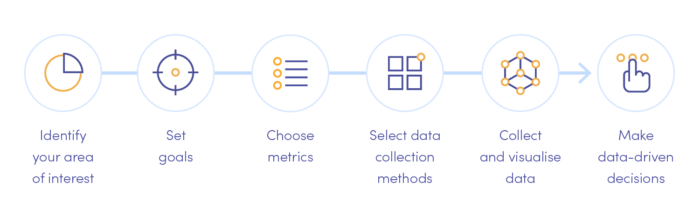
Implementing Data-Driven Decisions in the Design Process
Step 1 – Setting goals and objectives
Designers must establish clear goals and objectives before collecting and analyzing data. This goal-setting process involves identifying the key performance indicators (KPIs) aligning with user needs and business objectives. Setting specific, measurable goals enables designers to ensure their efforts and focus on the most impactful areas of the product or user experience.
Step 2 – Collecting and analyzing data
Once goals and objectives are in place, design teams must collect relevant quantitative and qualitative data from various sources, such as analytics tools, user surveys, and usability testing. Designers must employ rigorous methods to analyze this data, ensuring their conclusions are accurate and free from potential biases.
Step 3 – Identifying patterns and insights
Designers look for patterns and insights in collected data to inform their design decisions. This analysis may involve identifying user pain points, preferences, or behavior trends. By recognizing these patterns, designers can better understand user needs and make informed decisions throughout the design process.
Step 4 – Making data-informed design decisions
With valuable insights, designers can make data-driven decisions to address user needs and meet business objectives. This process involves iterating on the design, incorporating user feedback, and refining the product based on data. Designers often have to adjust or change direction as new data emerge, ensuring solutions remain relevant and practical.
Design teams build prototypes to test ideas and assumptions throughout the design process–from paper prototyping in the early stages to fully functional interactive prototypes later.
Step 5 – Using data to iterate and refine
Throughout the design process, it’s essential to measure the impact of design changes and iterate accordingly continually. Design teams monitor KPIs and gather ongoing user and stakeholder feedback, refining the design to optimize the user experience and achieve the desired results.
By embracing a data-driven approach, designers can ensure their work remains user-centric and aligned with user needs and business goals.
Examples of resesarch tools
User Analytics
Tools: Google Analytics, Hotjar, Mixpanel
What to Measure: Track user behavior, such as clicks, page views, session duration, and conversion rates.
Benefit: Provides insights into how users interact with your site or app, highlighting areas for improvement.
Heatmaps
Tools: Hotjar, Crazy Egg
What to Measure: Visualize user interaction on your site, such as clicks, scroll behavior, and attention hotspots.
Benefit: Helps understand where users focus their attention, indicating areas that need refinement.
A/B Testing
Tools: Optimizely, Google Optimize
What to Measure: Compare two versions of a page or feature to see which one performs better.
Benefit: Helps make data-backed decisions on design elements like button placement, copy, or color schemes.
User Surveys and Feedback
Tools: Typeform, SurveyMonkey, Usabilla
What to Measure: Direct feedback from users on their experience, needs, and pain points.
Benefit: Provides qualitative insights that can identify areas for improvement or new feature ideas.
Usability Testing
Tools: Lookback, UserTesting
What to Measure: Observe users as they interact with your product to identify usability issues and barriers.
Benefit: Helps spot usability issues directly from real users, ensuring design improvements align with their needs.
User Interviews
What to Measure: Conduct one-on-one interviews to gather deep insights into user goals, frustrations, and experiences.
Benefit: Provides qualitative insights that offer context to the quantitative data gathered.
Conversion Rate Optimization (CRO)
Tools: Crazy Egg, Unbounce
What to Measure: Monitor key performance indicators (KPIs) related to user conversion, such as form submissions or product purchases.
Benefit: Directly correlates user behavior to business outcomes, guiding design improvements that drive conversion.
User Personas & Journey Mapping
What to Measure: Combine qualitative data from surveys, interviews, and analytics to build accurate personas and map user